檔案:Largenumbers.svg
該檔案來自於維基共享資源,它可能在其它計劃項目中被應用。 它在檔案描述頁面那邊上的描述於下面顯示。
摘要
| 描述Largenumbers.svg |
Català: Una il·lustració de la llei dels grans nombres, semblant a File:LLN_Die_Rolls.gif però utilitzant el format svg en comptes de gif. Això utilitza dades diferents i, per tant, sembla diferent. El codi font es troba a la secció següent. El codi està sota la mateixa "llicència" que l'obra en si.
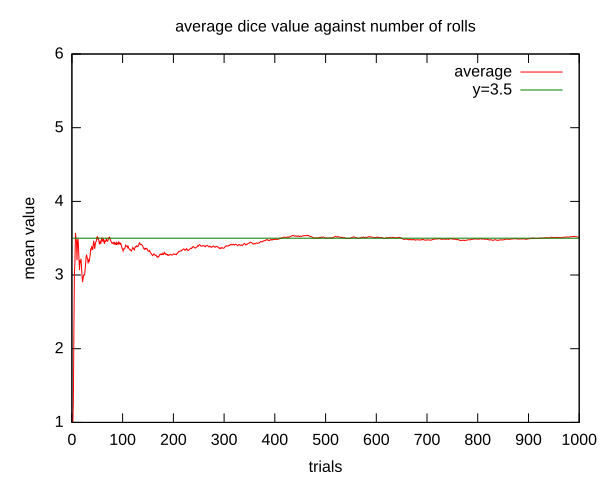
English: An illustration of the w:law of large numbers, similar to File:LLN_Die_Rolls.gif but using the svg format instead of gif. This uses different data from that and hence it looks different. Source code is in the section below. The code is under the same "license" as the work itself. |
| 日期 | (UTC) |
| 來源 | 自己的作品 |
| 作者 | NYKevin |
| 其他版本 |
File:Largenumbers.svg has 2 translations.
Other related versions:File:LLN_Die_Rolls.gif |
| This SVG file contains embedded text that can be translated into your language, using any capable SVG editor, text editor or the SVG Translate tool. For more information see: About translating SVG files. |
This file is translated using SVG <switch> elements. All translations are stored in the same file! Learn more.
For most Wikipedia projects, you can embed the file normally (without a To translate the text into your language, you can use the SVG Translate tool. Alternatively, you can download the file to your computer, add your translations using whatever software you're familiar with, and re-upload it with the same name. You will find help in Graphics Lab if you're not sure how to do this. |
Source code
Note that you will need to insert some paths. I've tried to make it obvious where to do so.
This code is all in the public domain (the cc0 waiver applies to it)
The code (in Java) which generated the data:
import java.io.*;
public class Main {
    public static void main(String[] args) {
        PrintStream output=null;
        try{
            output=new PrintStream("");//FIXME Insert a suitable path in the quote marks
        }catch(FileNotFoundException e){
            throw new RuntimeException(e);
        }
        //int diceValues[] = {0,0,0,0,0,0};//this variable may be uncommented and used for debugging
        double average=0;
        double total=0;
        output.println("#count average");//makes a header for the data; may be safely removed
        Random rnd=new Random(4124484382302655524l);
        //seed selected by trial and error
        for(int i=1;i<=1000;i++){
            int rand=rnd.nextInt(6);//now holds a random int from 0 to 5
            //diceValues[rand]++;//uncomment for debugging
            rand++;//convert to 1-indexed
            total+=rand;
            average=total/i;
            output.println(i+" "+(average));
        }
        //System.out.println(average);
    }

}
The gnuplot code:
set terminal svg
set output "OUTPUT PATH HERE"
set title "average dice value against number of rolls"
set xlabel "trials"
set ylabel "mean value"
plot [] [1:6] "PATH FROM JAVA CODE HERE" title "average" with lines, 3.5 title "y=3.5" with lines
#it is recommended that you copy and paste this code into a .plt file and run it in batch mode:
#If you must run this interactively, be sure to type "exit" or ^D (control-D) at the end,
#or gnuplot will leave off the </svg> closing tag.
MATLAB/Octave Source code
% Specify how many trials you want to run:
num_trials = 1000;

% Now grab all the dice rolls:
trials = randi(6, [1 num_trials]);

% Plot the results:
figure(1);

% Cumulative sum of the trial results divided by the index gives the
% average:
plot(cumsum(trials)./(1:num_trials), 'r-');

% Let's put a reference line at 3.5 just for fun (make the color a darker
% green as well):
hold on;
plot([1 num_trials], [3.5 3.5], 'color', [0 0.5 0]);

% Make it look pretty:
title('average dice value against number of rolls');
xlabel('trials');
ylabel('mean value');
legend('average', 'y=3.5');
axis([0 num_trials 1 6]);
授權條款
| 此檔案於創用 CC CC0 1.0 通用公有領域貢獻宣告下分發。 | |
| 在此宣告之下分發本作品者,已依據各國著作權法,在全世界放棄其對本作品所擁有的著作權及所有相關相似的法律權利,從而將本作品貢獻至公有領域。您可以複製、修改、分發和演示該作品,用於任何商業用途,所有這些都不需要請求授權。
http://creativecommons.org/publicdomain/zero/1.0/deed.enCC0Creative Commons Zero, Public Domain Dedicationfalsefalse |
| 註解 InfoField | 該圖片含有註解:在維基媒體共享資源上查看註解 |
On the left, random fluctuations are evident.
Here, the average begins to level out around 3.5
說明
在此檔案描寫的項目
描繪內容
31 1 2010
image/svg+xml
檔案歷史
點擊日期/時間以檢視當時出現過的檔案。
| 日期/時間 | 縮圖 | 維度 | 使用者 | 註解 | |
|---|---|---|---|---|---|
| 目前 | 2024年11月15日 (五) 14:54 |  | 600 × 480(25 KB) | Dr. Greywolf | File uploaded using svgtranslate tool (https://svgtranslate.toolforge.org/). Added translation for yue. |
連結
以下的2個頁面連接到本檔案:
元數據
| 圖片標題 | Produced by GNUPLOT 4.2 patchlevel 5 |
|---|---|
| 寬度 | 600 |
| 高度 | 480 |


